

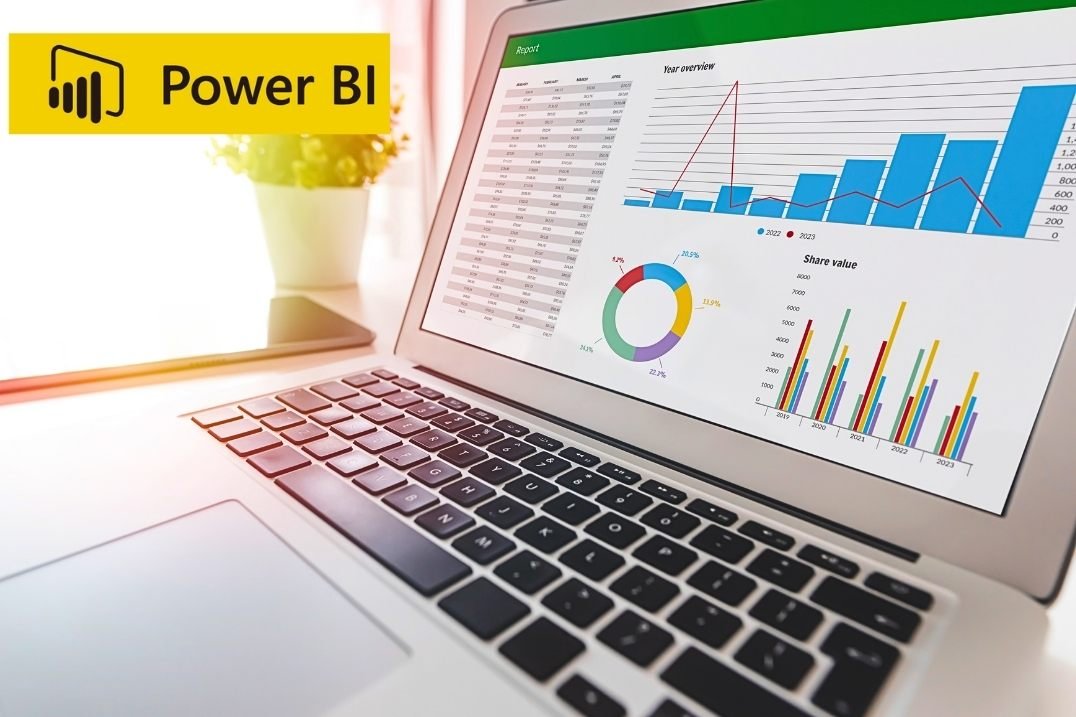
Microsoft Power BI is a business intelligence and data visualisation platform that helps users pull together data from various sources and use this to create interactive dashboards and share reports. Power BI can be used by many businesses, students, data analysts, and professionals to make sense of their complex data sets.
Whether you want to look at your sales performance, track your growth, keep track of your finances, or start a career in data analytics, Power BI will offer you tools to help you explore your data. An important aspect of modern business is having the right data to understand how a business is performing, see what trends there are, and make the best decisions possible. However, getting insight out of large quantities of data can be very time-consuming if using spreadsheets and doing this manually. This is where Power BI can be used.
This article shows you the features, tools, cost, process, uses, benefits, drawbacks, and alternatives to Power BI in 2026.
What is Microsoft Power BI?
Microsoft Power BI is a business intelligence platform that lets you connect with your data, analyse it, and create interactive reports and dashboards. This helps you turn your raw data into visual insights to help you make decisions for your business.
It has been created by Microsoft and can connect to various data sources such as Excel spreadsheets, SQL databases, Cloud environments, and other business applications. With Power BI, you do not have to manually look at thousands of rows of data in your spreadsheet; instead, you can look at charts, graphs, tables, and interactive filters to easily understand your results. This makes Power BI ideal for business intelligence analysts, data analysts, financial professionals, marketing teams, managers, and any organisations that use data-driven decisions.
There are three main components to Power BI: Power BI Desktop – Create reports; Power BI Service – Publish and share; Power BI Mobile – View reports on compatible mobile devices. One of the main benefits of Power BI is the integration with the rest of the Microsoft suite, including Excel, Azure, and other business applications.
Key Features of Power BI
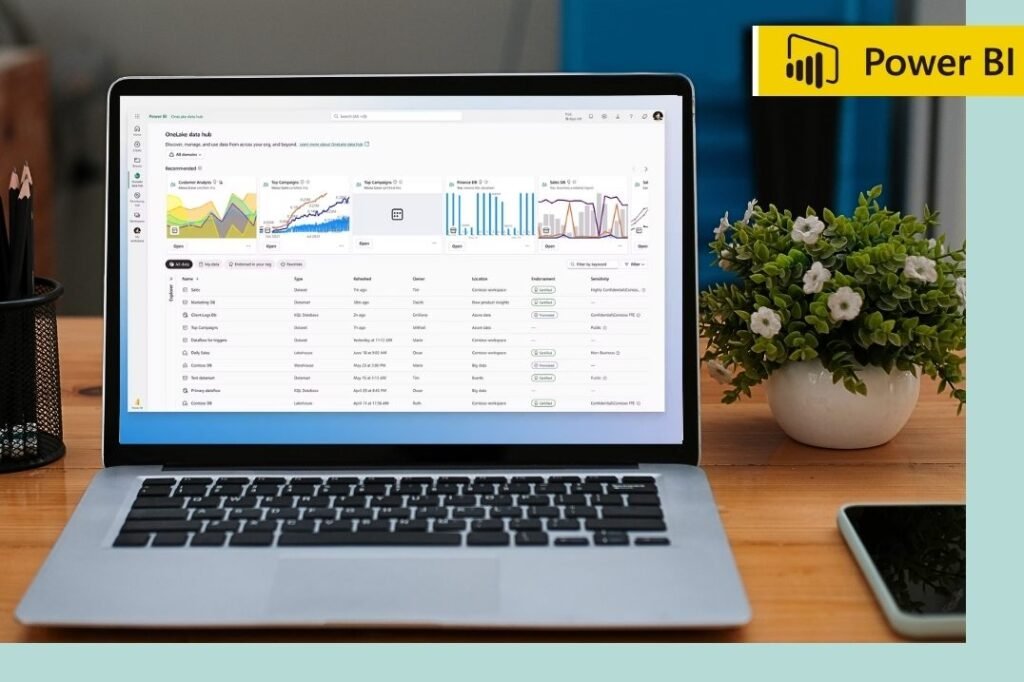
There are a number of key features within Power BI to help you prepare, analyse, and visualise your business data. Whether you are a beginner looking to create basic reports or an organisation that needs to keep track of complex analytical processes.
Interactive Data Visualisations
Within Power BI, you can make your raw data into visual reports. You can create charts, graphs, tables, maps, and other visualisations. You can create bar charts to compare your sales, line charts to track your monthly revenue, pie charts to show category breakdowns, and interactive filters to see certain time frames, products, regions, and departments. This will help you to see trends within your data.
Multiple Data Sources
Power BI can connect to multiple data sources such as Excel documents, SQL databases, Cloud environments, and other business applications. This means you can bring data from multiple sources together.
For example, your business can bring together sales data from Excel, customer data from your database and advertising data from your marketing platform to create one report.
Power Query
Power Query is a data preparation tool. This helps you to clean your data.
You can delete duplicates, change data types, rename columns, replace blanks, split columns, and merge data sets.
This helps you to clean up your data and reduce repetitive tasks.
DAX
Data Analysis Expressions (DAX) is a formula language that can be used to create calculations within Power BI.
You can create measures, calculated columns, and calculated tables to analyse your data. For example, you can calculate your total revenue with:
Total Revenue = SUM(Sales[Revenue])
You can also calculate your total profit with:
Total Profit = SUM(Sales[Profit])
This is particularly useful if your reports require dynamic calculations that depend on your filters.
Interactive Dashboards and Reports
Within Power BI, you can create reports with multiple visualisations. You can add filters, click on parts of your charts and look at related data. Within the Power BI Service, you can create dashboards to give you an overview of your key business metrics.
For example, your sales dashboard can show your total revenue, monthly growth, top-selling products, regional sales and sales targets.
AI Analytics
Power BI can be integrated with AI using the Microsoft Fabric ecosystem. Depending on your licences, setup, and availability, you can utilise AI analytics and Copilot. This can help you to explore your data, summarise your insights, and create reports.
However, always double-check that the results from the AI are accurate by checking the data.
Security
Power BI can be secured. For example, row-level security (RLS) can be added. This will mean that users can only see certain rows of data. For example, a company can set up its sales report so that each region manager only sees their region.
It is important to set this up correctly and test to ensure sensitive data is kept secure.
Share Reports
Within the Power BI Service, you can publish your reports. You can organise reports into workspaces and work with colleagues. Organisations can share their analytical reports with authorised users and use reports within compatible Microsoft applications. Depending on your licence and capacity, you will have the ability to share your reports.
Tools Available in Power BI
Power BI includes several components that support different stages of the data analysis process.
| Tool | Main Purpose |
| Power BI Desktop | Create reports and data models |
| Power BI Service | Publish, share, and manage reports online |
| Power BI Mobile | View reports on mobile devices |
| Power Query | Clean and transform data |
| DAX | Create calculations and analytical measures |
| Power BI Report Builder | Create paginated reports |
| On-premises Data Gateway | Connect supported local data sources to cloud services |
| Power BI Embedded | Integrate Power BI analytics into applications |
| Power BI Copilot | Assist with supported analytical and reporting tasks |
Also, Explore: MavishTech Review 2026: Technology Solutions, Software Services, Digital Solutions & Complete Guide
How to Use Power BI
To begin building your first interactive report using a spreadsheet, follow the steps below.
Install Power BI Desktop
Step1: Go to the official Microsoft site and download Power BI Desktop.
This is only available on Windows. If you are on Mac OS, you will need to have a compatible Windows setup.
Step2: Import Data
Open Power BI Desktop and click Get Data.
Select your data source, such as an Excel workbook or CSV. Choose your file and select the table you want to import.
Step3: Open the Power Query Editor
Remove any unnecessary columns, change data types, remove duplicates, and clear any blanks.
Step4: Ensure your date column has a data type of Date and your revenue has a data type of either Number or Currency.
Step 5: Build your Data Model
Check your relationships.
If you have multiple tables, such as Sales, Products, and Customers, add the relationships. Having a well-designed data model will help avoid errors when calculating your data.
Build Measures with DAX
- Create measures for key metrics.
- Total Sales = SUM(Sales[Revenue])
- Total Quantity = SUM(Sales[Quantity])
- Total Profit = SUM(Sales[Profit])
This assumes you have a table called Sales with the column names shown above.
Step 6: Build Report: Insert visuals
Create a column chart to show sales per product, a line chart to show revenue per month, plus cards for total sales and profit.
Include slicers to allow users to filter by date, product, and region.
Step 7: Publish your Report
Once you have finished your report, if you have the correct account, you can publish it to the Power BI Service. From there, you can organise your report.
Note that you won’t automatically have it public. You will need to share it with the correct permissions.
Power BI Pricing Plans
Power BI offers a free option and paid licenses for users who need report sharing, collaboration, or advanced analytical capabilities.
| Plan | Indicative Price | Main Features |
| Free | ₹0 | Create reports and analyze data for personal use |
| Power BI Pro | Around ₹1,165 per user/month | Publish, share, and collaborate on reports |
| Power BI Premium Per User | Around ₹1,995 per user/month | Pro features plus additional premium capabilities |
| Power BI Embedded | Variable | Embed analytics into applications |
| Microsoft Fabric Capacity | Variable | Organization-level capacity and analytics services |
Power BI vs Competitors
Power BI competes with other business intelligence platforms that help organizations analyze data and create interactive reports.
| Feature | Power BI | Tableau | Qlik Sense |
| Developer | Microsoft | Salesforce | Qlik |
| Primary Purpose | Business intelligence and reporting | Data visualization and analytics | Business intelligence and data exploration |
| Data Visualization | Strong | Strong | Strong |
| Data Transformation | Power Query | Tableau Prep and related tools | Data integration and transformation tools |
| Formula Language | DAX | Calculated fields and expressions | Set analysis and expression language |
| Microsoft Integration | Excellent | Available | Available |
| Free Learning Options | Power BI Desktop | Tableau Public | Options vary |
| Best For | Microsoft-focused businesses and analysts | Visualization-focused analytics | Associative data exploration |
Coupon Codes and Discounts
Most of the time, there will be no discount codes available to reduce the price of the main Power BI application. Power BI Desktop can be used for free, with Microsoft offering licensing options for extra features.
Some ways that you can save money with Power BI:
- Power BI Desktop – You can freely create reports, data models, and analyse your data.
- Microsoft 365 E5 – If you have an eligible Microsoft 365 E5 subscription, then you will have access to Power BI Pro features.
- Students – Check if you have access to Power BI or Microsoft Fabric through your educational institution.
- Trials – Check what Microsoft is currently offering to see if you can get a trial for the required paid features.
- Licensing – If you’re a business, you can look at what licensing you would need depending on how many users are creating and viewing reports.
Before purchasing any subscriptions, always make sure that you are eligible for any discounts and what the current prices are.
Applications of Power BI
Power BI is used in many industries to analyse business performance, track operations, and make data-driven decisions.
Business analytics
Businesses use Power BI to track revenue, costs, sales performance, and profit.
Managers can create dashboards to view monthly growth, regional performance, customer trends, and business goals. This helps organisations identify opportunities and make better decisions.
Financial analysis
Finance professionals can use Power BI to analyse budgeting, cash flow, costs and financial performance.
For example, a finance dashboard can show you how much you are actually spending compared to your planned budget and highlight any areas where there are large variances in costs.
Marketing analytics
Marketing teams can use Power BI to track campaign performance, web traffic, leads, and conversion rates.
By pulling together data from various marketing sources, you can identify which campaigns are performing well.
Sales performance
Sales teams can use Power BI to track revenue, customer acquisition, product performance and personal sales goals.
Interactive reports can be created to compare sales performance between regions, products and time frames.
Human resources analytics
HR can analyse staff turnover, recruitment performance, attendance, and workforce. This can help organisations identify any issues they may be having with staffing and assess their recruitment strategies.
Pros and Cons
Power BI provides powerful reporting capabilities, but users should understand its limitations before choosing it for a project.
| Pros | Cons |
| Free desktop application | Desktop application is designed for Windows |
| Interactive dashboards and reports | Advanced features may require paid licenses |
| Integrates well with Excel | DAX can be challenging for beginners |
| Supports multiple data sources | Complex data models require careful design |
| Power Query simplifies data cleaning | Large datasets can require performance optimization |
| Supports business intelligence workflows | Sharing permissions and licensing can be confusing |
| Provides data security features | Incorrect security configuration can expose sensitive data |
| Suitable for students and professionals | Some advanced features depend on organizational capacity |
Performance and User Experience
Power BI provides a visual drag-and-drop interface for creating reports.
You can very easily start using Power BI with basic projects by importing an Excel file, selecting columns and creating charts. As your project gets more complicated, you can learn about Power Query, DAX,
Relationships & Data Modelling.
Performance will depend on a few different factors such as:
- Removing unnecessary columns & rows.
- Correct data types are used.
- Creating a clear data model with meaningful relationships.
- Not using overly complicated DAX calculations.
- Using correct visualisations.
- Security for sensitive information.
Testing the performance of your reports.
Overall, Power BI is fairly easy to get started with; however, it takes time to create professional dashboards and data models.
Can Power BI run On A MacBook?
There isn’t a native macOS version of Power BI Desktop. However, you can still use Power BI Service through your browser. However, most reports would be created in Power BI Desktop. If you do require Power BI Desktop, then there are ways to find a compatible Windows environment. You should also check the system requirements for your specific Mac.
Who Should Use Power BI?
- Students: Students can learn data visualisation, data modelling and business intelligence by creating practical projects.
- Data Analysts: Data analysts can clean data, calculate metrics and present their findings.
- Business Analysts: Business analysts can track KPIs, find gaps in performance and make decisions based on the data.
- Finance: Finance teams can analyse budgets, costs, revenues & profitability.
- Marketing: Marketing teams can track campaign performance, customer acquisition & conversions.
- Sales Managers: Sales managers can track revenue, compare performance, and track targets.
- Business Owners: Small businesses can use dashboards to track sales, costs, stock & growth.
- Enterprise Teams: Enterprise teams can share reports and have consistent metrics across their business.
Is Power BI Worth Learning In 2026?
Yes! If you want to improve your skills around data analytics, reporting & business intelligence, then Power BI is a great option.
As a student looking to go into computer science or AI-related careers, Power BI can be used alongside your programming and machine learning knowledge. This will teach you how to clean data, analyse performance, and present your findings.
However, Power BI alone will not guarantee you a job. Using Power BI with SQL, Excel, statistics, data modelling and practical projects will make your skills more useful.
Conclusion
Power BI is a powerful business intelligence tool which can help you turn raw data into interactive reports and meaningful insights. It has many features such as data visualisation, data transformation, DAX calculations, dashboards, security features & reporting. Power BI is a great option for students and beginners due to the free desktop application. There are paid versions that allow you to share reports, collaborate, and perform more advanced analysis. It can be used throughout many areas of business, including analytics, finance, marketing, healthcare, education, sales & supply chain management.
FAQs
Power BI is used for analysing data, creating interactive dashboards, visualising business performance and generating reports.
Yes, Power BI Desktop is a free application. However, if you want to share your reports, you might need a paid licence.
Yes! You can start with Excel files and simple charts. Once you get more confident, you can learn about Power Query, DAX & Data Modelling.
No, basic reports don’t require any coding. However, DAX is useful for calculations, and Power Query uses M language, which can help with more advanced data transformations.
There isn’t a native version of Power BI Desktop for macOS. However, there are options for Mac users to use the supported online features. You can also look into finding a compatible Windows environment.
Also, Read:
Synthesia: AI Video Generator, Features, Pricing, How to Use, and More

